


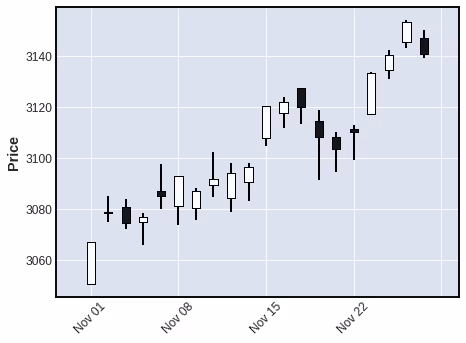
1. How to Read a Candlestick Chart (Best for Short-Term Traders)
If there’s one chart every trader should master, it’s the candlestick chart. Originating in Japan centuries ago, this chart type has become the go-to choice for technical analysts across all markets - from forex to crypto to stocks.
- Open – The price at the beginning of the period
- High – The highest price reached during the period
- Low – The lowest price
- Close – The price at the end of the period
The body of the candle shows the range between the open and close. If the close is higher than the open, the body is typically green (bullish); if the close is lower, it’s red(bearish). The thin lines (wicks or shadows) above and below the body represent the high and low.
🔍 Why is it powerful?
Candlestick charts give more than just price - they show market psychology. For example:
- A long wick at the top suggests buyers pushed the price up, but sellers took control before the candle closed.
- A doji (where open and close are nearly equal) can indicate indecision or a potential reversal.
- Patterns like bullish engulfing, hammer, or shooting star are used to predict momentum shifts.
These visual clues are faster to read and easier to interpret than raw numbers, making them essential for:
- Identifying entry and exit points
- Spotting trend reversals
- Confirming breakouts or breakdowns
- Reading support and resistance levels
📈 Example in Action:
Imagine you’re trading Bitcoin on a 15-minute chart. You spot a bullish engulfing pattern right above a support zone. That’s a classic signal that buyers are stepping in - and it could be your green light to go long.
At Hoorah, our traders rely on candlestick patterns to react fast and make informed decisions - especially in fast-moving markets like crypto.
🔥 Want to put your candlestick skills to the test?
Our funded traders at Hoorah use these exact patterns to dominate the markets.
✅ Join a live challenge and test your timing on BTC, ETH, or your favorite pair - with zero risk.
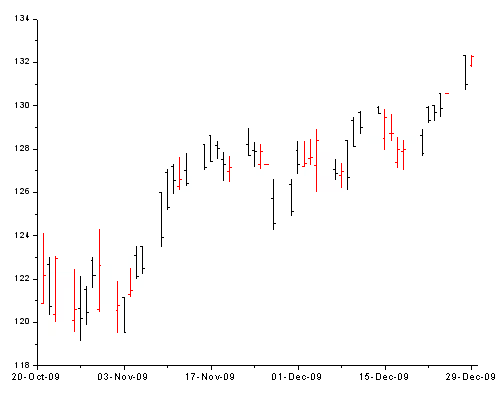
2. OHLC Bar Chart Explained: Best for Measuring Volatility
Before candlestick charts took over, the bar chart - also known as the OHLC chart - was the standard for technical traders. It might look simpler at first glance, but it’s incredibly powerful for reading market structure and volatility.
Each bar represents four price points for a selected time frame:
- Open – Shown as a short tick to the left of the vertical bar
- Close – Shown as a short tick to the right
- High – The top of the vertical line
- Low – The bottom of the vertical line
This clean structure gives you the full range of price movement within a period while minimizing visual distractions like color filling.
🔍 What makes it useful?
Bar charts are preferred by traders who want maximum detail with minimal noise. Unlike candlesticks, which emphasize sentiment through visual patterns, bar charts lean toward objective precision:
- The length of the bar shows the level of volatility: longer bars = wider price movement
- The position of the close relative to the open helps identify bullish or bearish sentiment- Series of higher highs and higher lows can signal an uptrend forming- Narrow bars with small ranges often indicate consolidation or indecision
📊 Reading the Story:
Let’s say you’re analyzing EUR/USD on an hourly chart. You spot several bars with higher highs and higher closes, all closing near their highs. That’s a textbook sign of strong bullish momentum. A bar chart reveals this cleanly - no distractions, no shadows, no filler.
✅ When to Use It:
- When you want to measure volatility precisely
- When you’re building or back testing price-based strategies
- When analyzing multi-timeframe trends - especially useful when combined with moving averages or volume indicators
At Hoorah, many of our funded traders combine bar charts with indicators like RSI or MACD to reduce bias and trade based on pure price structure.
📊 Build your price-action strategy today.
Hoorah lets you analyze raw market structure with real-time charting tools and instant feedback in live market conditions
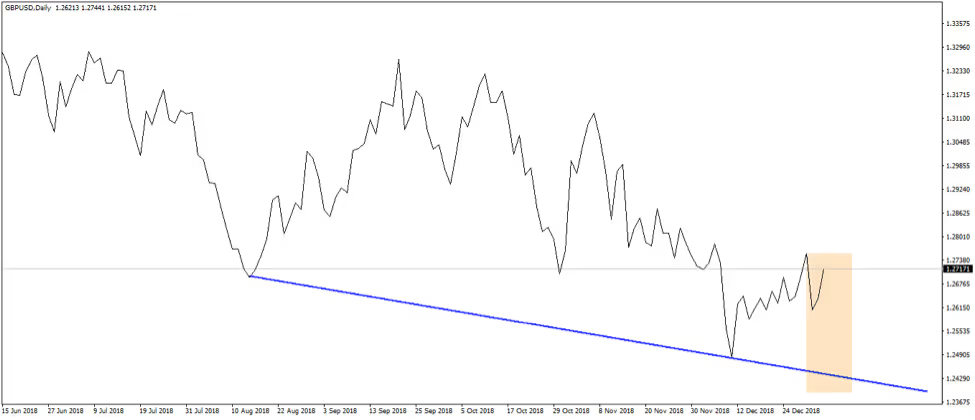
3. Line Chart in Trading: Best for Long-Term Trend Analysis
The line chart is the most straightforward of all trading charts - and often the most overlooked. Despite its simplicity, it's a powerful tool for visualizing long-term trends, reducing noise, and keeping your focus where it matters: the closing price.
A line chart plots a single data point per period - usually the closing price - and connects each point with a line. No open, no high, no low. Just close. Why? Because the closing price is considered the most important price of the day - it reflects the final consensus between buyers and sellers.
📈 Why Use a Line Chart?
Line charts strip the chart down to its purest form, helping you:
- Identify overall market direction clearly (uptrend, downtrend, range)
- Spot support and resistance areas with minimal distractions
- Track historical performance over weeks, months, or even years
- Compare multiple assets on the same chart (e.g. BTC vs ETH, or SPX vs Nasdaq)
It’s the preferred chart for:
- Long-term investors who care more about overall growth than intraday noise- Portfolio managers tracking equity curve or account growth- Beginners learning to understand price movement without being overwhelmed
🔍 Example in Action
You’re evaluating Ethereum’s 12-month trend. A candlestick chart might show lots of ups and downs, false signals, and wicks. But a line chart reveals a smooth upward trajectory, showing you the real picture: Ethereum has been trending up steadily. That’s insight you can act on.
Or imagine comparing your Hoorah account performance vs. BTC's price over 3months. A dual-line chart lets you see how your strategy performed against the market - visually, instantly.
⚠️ What It Doesn’t Show:
- Volatility – You don’t see highs or lows
- Price action within the period – Just the close
- Entry signals – It's not ideal for tactical entries
That’s why many traders use line charts for macro direction, then switch to candlesticks or bars for precision entries.
At Hoorah, we encourage traders to use line charts to track long-term growth and refine their trading psychology. When you zoom out, patterns become clearer - and emotions become quieter.
📈 Track your growth, not just the market.
Compare your performance vs the market with Hoorah’s account analytics.
🔒 100% Crypto. No banks. No cards. No Limits!
Which Trading Chart Should You Use? Candlestick vs Bar vs Line
There’s no universal “best” chart - only the best chart for your strategy.
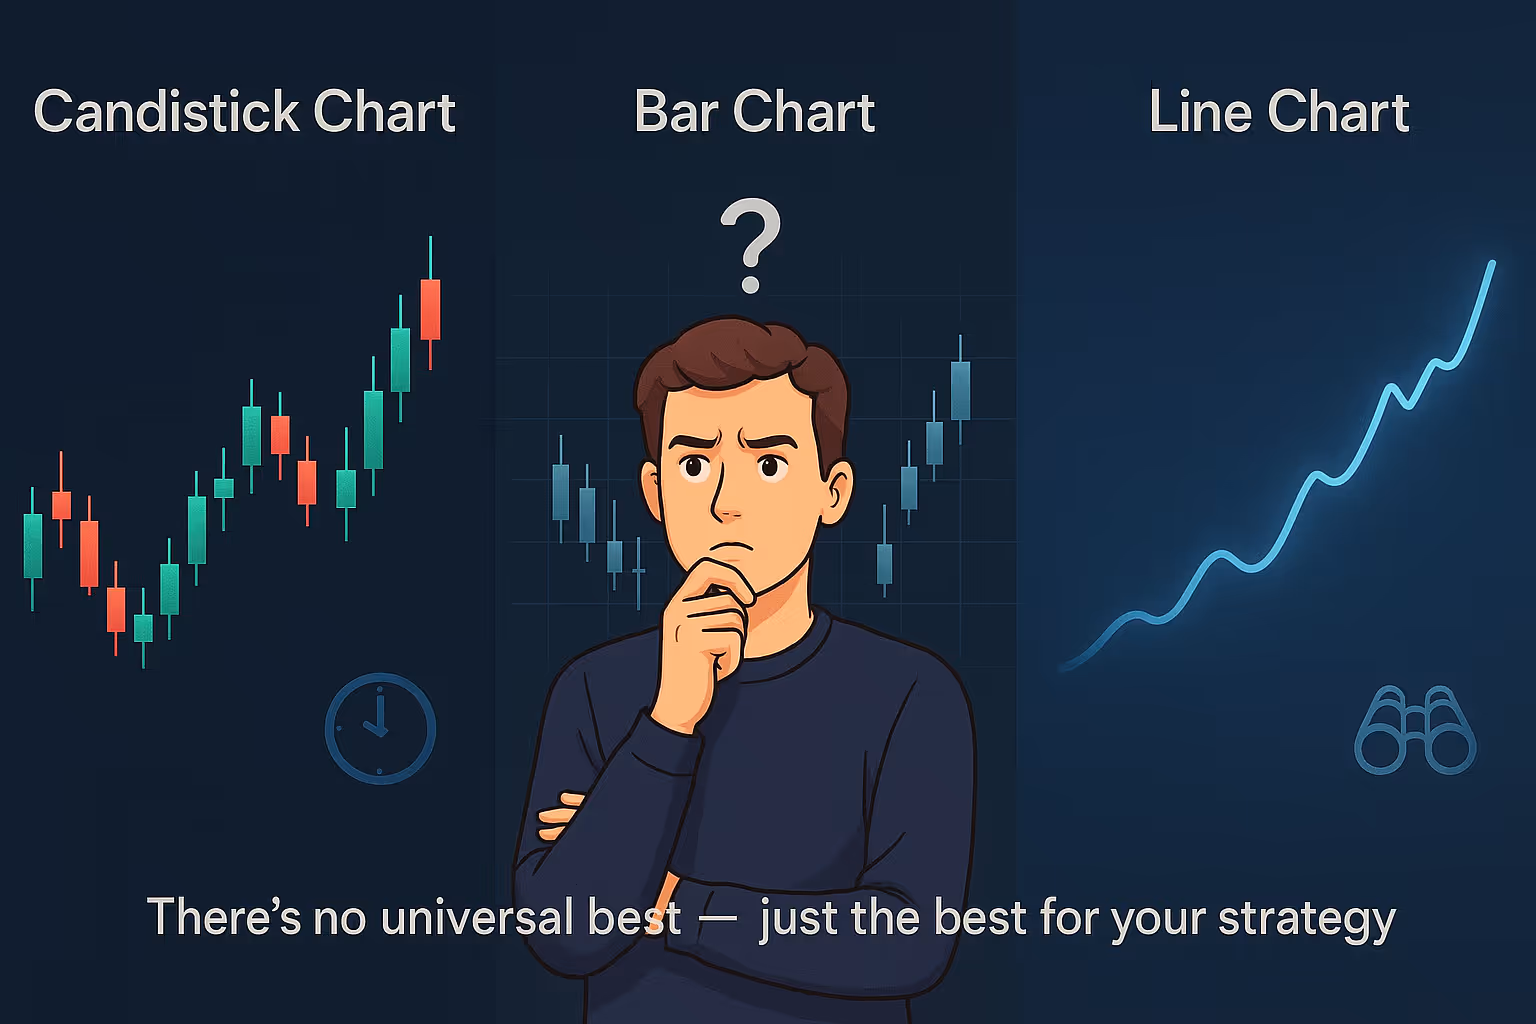
Here’s a quick breakdown:
🔸 Candlestick Chart → Perfect for short-term traders who need to read market sentiment, spot reversals, and time entries and exits with precision.
🔸 Bar Chart (OHLC) → Ideal for traders who want maximum price detail and a clean, data-focused view without distractions. Great for building structured, price-action strategies.
🔸 Line Chart → Best for long-term investors and those focused on big-picture trends, performance tracking, and staying above the noise.
The real power comes when you learn to combine them. Use line charts to define the trend, bar charts to assess volatility, and candlesticks to make your move.
🚀 Ready to trade with confidence?
Whether you’re reading candlesticks, bar charts, or line graphs - your edge is only as sharp as your tools.
With Hoorah Trade, you get:
- 100% crypto
- No risk of capital loss
- Fast withdrawals, no banks needed
❓ FAQ: Choosing the Best Trading Chart for Your Strategy
🔹 What is the easiest chart for beginners to use?
The line chart is the most beginner-friendly. It shows only the closing prices overtime, helping new traders focus on trends without being overwhelmed by too much data.
🔹 Which chart is best for crypto trading?
Most crypto traders prefer the candlestick chart because it reveals market psychology, momentum, and potential reversals - all crucial in fast-moving markets.
🔹 Can I use these charts for both forex and stocks?
Yes! These chart types — candlestick, bar (OHLC), and line — are universal across all asset classes: forex, stocks, crypto, commodities, and indices.
🔹 What’s the difference between candlestick and bar charts?
Both show the same data (open, high, low, close), but:
- Candlesticks emphasize visual patterns and sentiment (bullish/bearish).
- Bar charts highlight price precision and volatility without color distractions
🔹 How can I choose which chart to use?
It depends on your style:
- 🕯 Candlestick → Best for timing entries/exits
- 📊 Bar Chart → Best for technical detail and structure
- 📈 Line Chart → Best for trend overview and clarity
Many pro traders combine all three to get a full picture of the market.
🔹 Can I use all three charts together?
Absolutely. For example:
- Use a line chart to identify the long-term trend.
- Switch to a bar chart to check volatility.
- Zoom into a candlestick chart for your entry/exit decision.
At Hoorah, many funded traders follow this layered approach.
🔹 Where can I practice reading these charts?
You can practice in live market conditions — with zero risk — through our crypto-based prop trading challenges.


